I apologize. I feel strong peer pressure to have an opinion about the Chappelle special. I didn’t watch it yet but I did read the transcript. “He comes off guilty in the transcript”. By guilty I mean guilty of delivering on Chappelle-esque humor. I have plenty of other opinions but I am not going to share any of them here. In stead, I’m just going to try and summarize what the people tweeting about Chappelle felt in the immediate aftermath of the special. I used the ‘tidytext’ package for most of this.
I searched for tweets with the words "chappelle" OR "davechapelle" OR "Sticks and Stones"; I got about 100,000 tweets that were not retweets and not tweets from news outlets or linked to news articles. I filtered retweets because I already have retweet counts for each tweet. I filtered tweets linking to news articles because form an original opinion people! Plus, he was also in the news for organizing a benefit concert near Dayton at the same time the special dropped; people were talking about that as well. Also, most people tweeting on the 26th were tweeting about watching or wanting to watch the special. Can’t believe these people waited till after watching it to make up their mind! Anyway, so I decided to just mine the tweets from August 27th through September 2nd.
Here’s a wordcloud of the 50 most frequent words.
DCmenant %>%
  anti_join(custom_stop_words) %>%
  count(word) %>%
  with(wordcloud(word, n, max.words = 50))
## Joining, by = "word"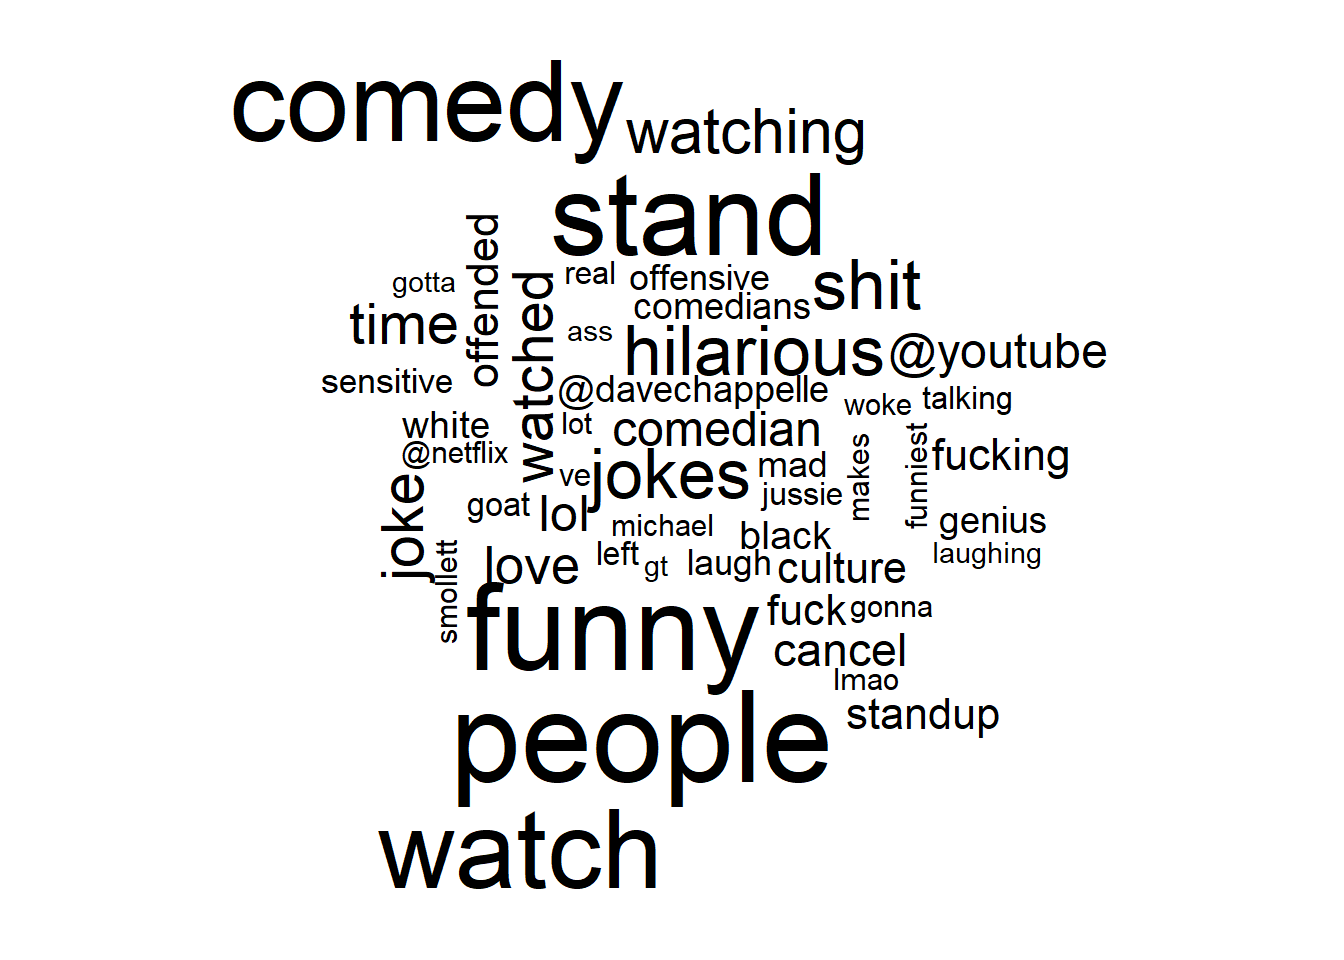
Just for future reference, if you’re tweeting about a standup special try not touse the words “stand up” or “standup” or “special”; makes for really uninteresting wordclouds. What I can infer from the wordcloud: People watching comedian @davechappelle’s stand up love funny jokes; Offensive jokes offended people.
Here is a comparison wordcloud that shows the top negative and positive words. I used the ‘bing’ lexicon to identify negative and positive words. This is a funny lexicon which categorizes funny and joke as negative words!?
DCmenant %>%
  inner_join(get_sentiments("bing")) %>%
  count(word, wt=wt, sentiment, sort = TRUE) %>%
  acast(word ~ sentiment, value.var = "n", fill = 0) %>%
  comparison.cloud(colors = c("gray20", "gray80"),
                   max.words = 50)
## Joining, by = "word"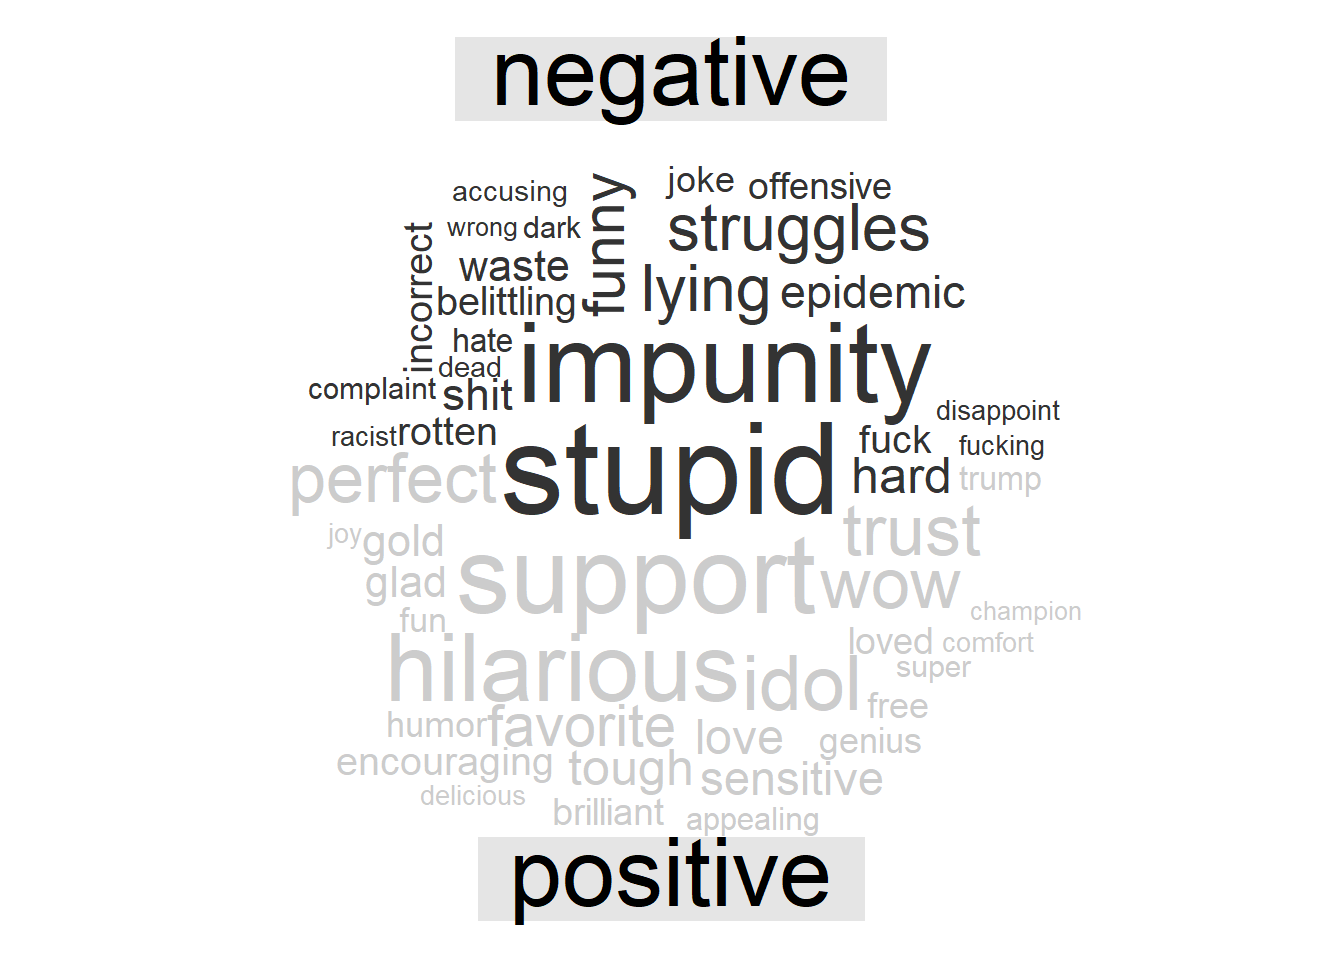
Is Chappelle now a stupid person with impunity or is he still the the perfect hilarious idol? Wordclouds tell you nothing, but they’re easy to generate and sometimes not too ugly.
Here are the top 10 words used to describe the special on twitter. I used the ‘nrc’ lexicon this time.
## Joining, by = "word"## Selecting by n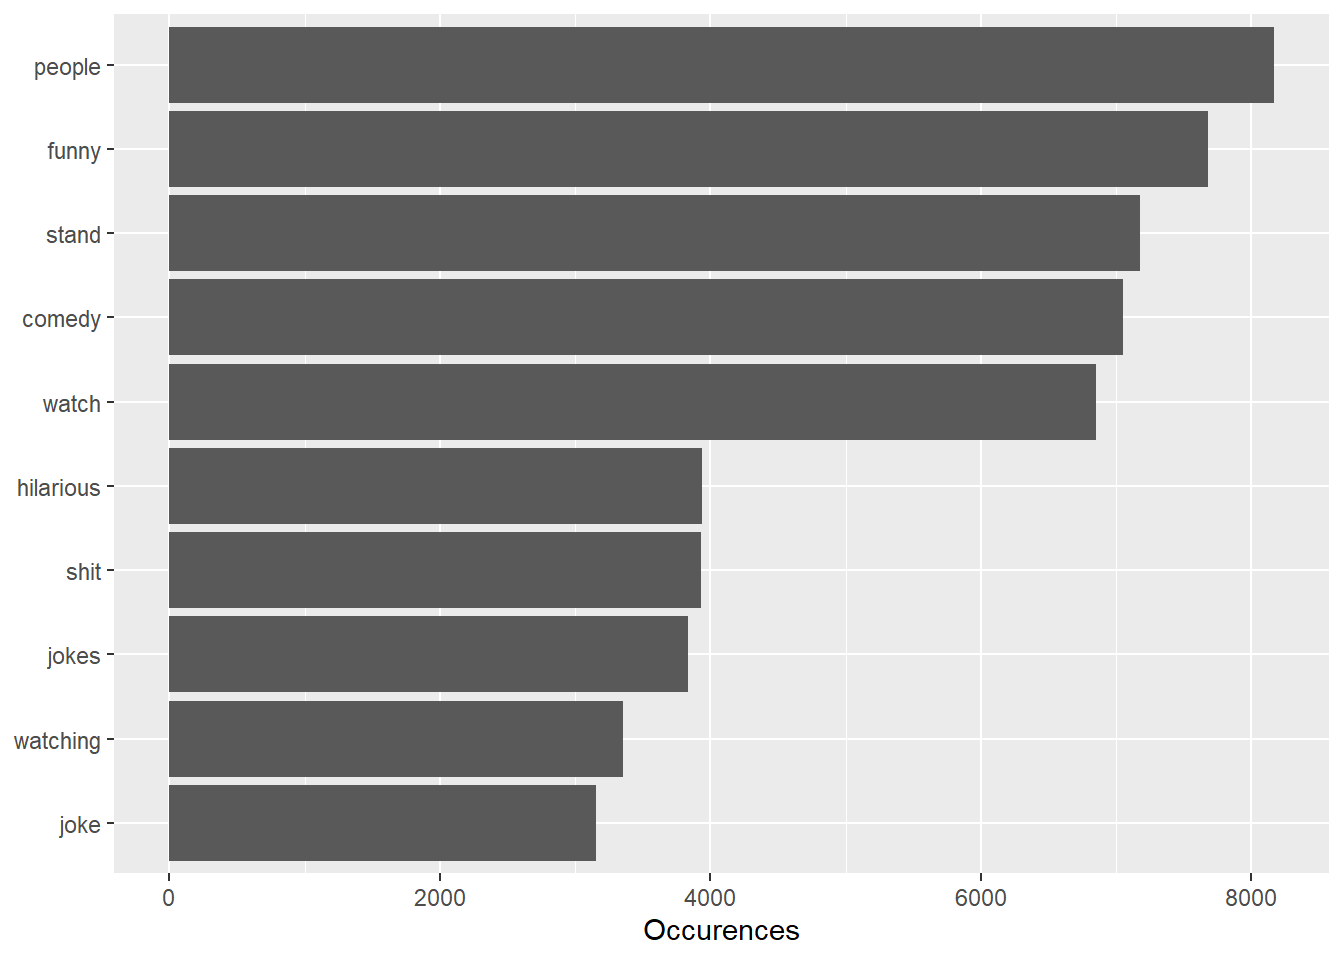
And here are top 10 negative and positive sentiment words used to describe the special.
nrc_word_counts %>%
  group_by(sentiment) %>%
  top_n(10) %>%
  ungroup() %>%
  mutate(word = reorder(word, n)) %>%
  ggplot(aes(word, n, fill = sentiment)) +
  geom_col(show.legend = FALSE) +
  facet_wrap(~sentiment, scales = "free", nrow=2) +
  labs(y = "Occurences",
       x = NULL) +
  coord_flip()
## Selecting by n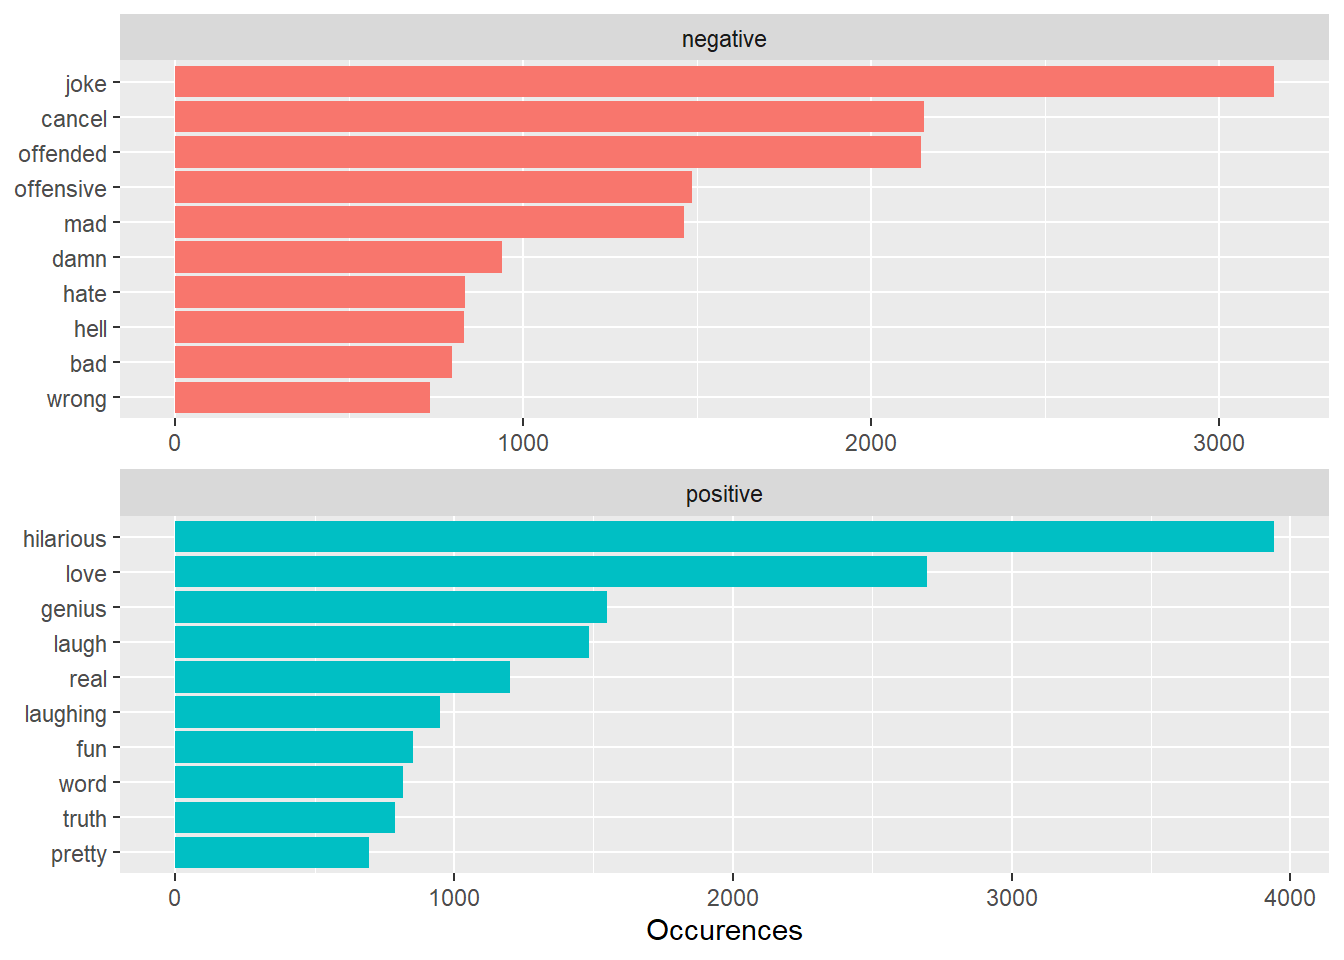
A lot more ‘love’ than ‘hate’; more ‘hilarious’ than ‘upset’. Some of the negative words may have been used by people who were just talking about it. More on this later.
The ‘nrc’ lexicon also classifies words into eight emotions. The most prevalent emotions, as measured by frequency of word usage, was either anticipation, anger, joy and sadness in that order. Not many were surprised. They clicked on his face, remember. I left out trust and fear from the plot as I don’t think they’re really applicable here.
ggplot(emotion_words_count, aes(x=Date, y=freq, color=sentiment, group=sentiment)) +
  geom_line(size=1) +
  geom_point(size=0.5) +
  xlab("Day") +
  ylab("Emotion words count (n)") +
  ggtitle("Emotions expressed in days following special") +
  theme(axis.text.x = element_text(angle = 90))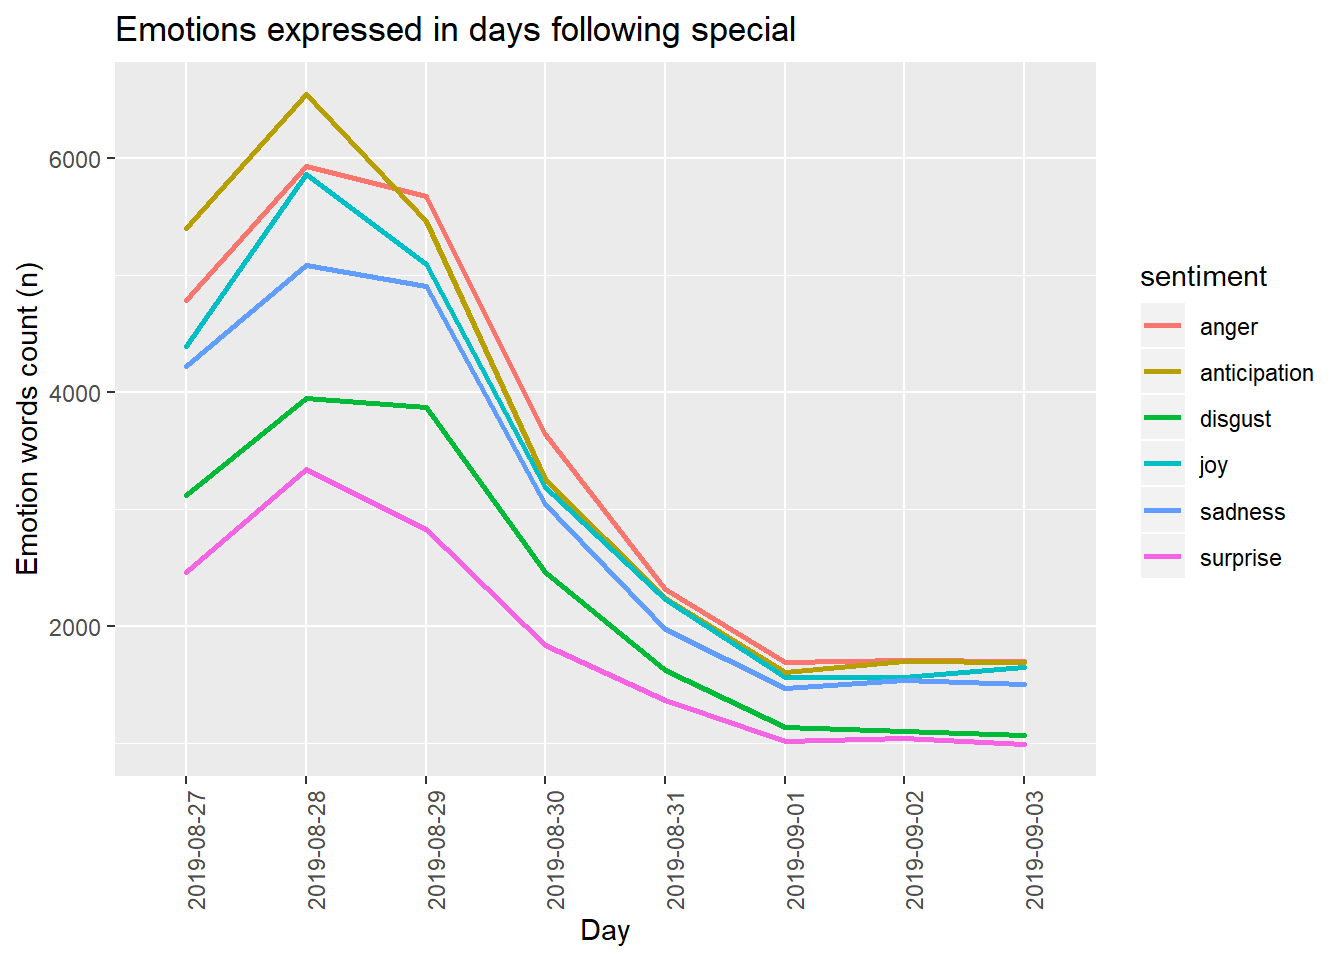
Here’s a look at the top words that belong to to each of the top four emotions: anticipation, anger, joy and sadness.
nrc_adjs <- get_sentiments("nrc") %>%
  filter(sentiment  %in% c("anger", "anticipation","joy","sadness"))

DCmenant %>%
  anti_join(custom_stop_words) %>%
  inner_join(nrc_adjs) %>%
  count(word, sentiment) %>%
  ungroup() %>%
  group_by(sentiment) %>%
  top_n(10) %>%
  ungroup() %>%
  mutate(word = reorder(word, n)) %>%
  ggplot(aes(word, n, fill = sentiment)) +
  geom_col(show.legend = FALSE) +
  facet_wrap(~sentiment, scales = "free_y", nrow=2) +
  labs(y = "Occurences",
       x = NULL) +
  coord_flip()
## Joining, by = "word"
## Joining, by = "word"## Selecting by n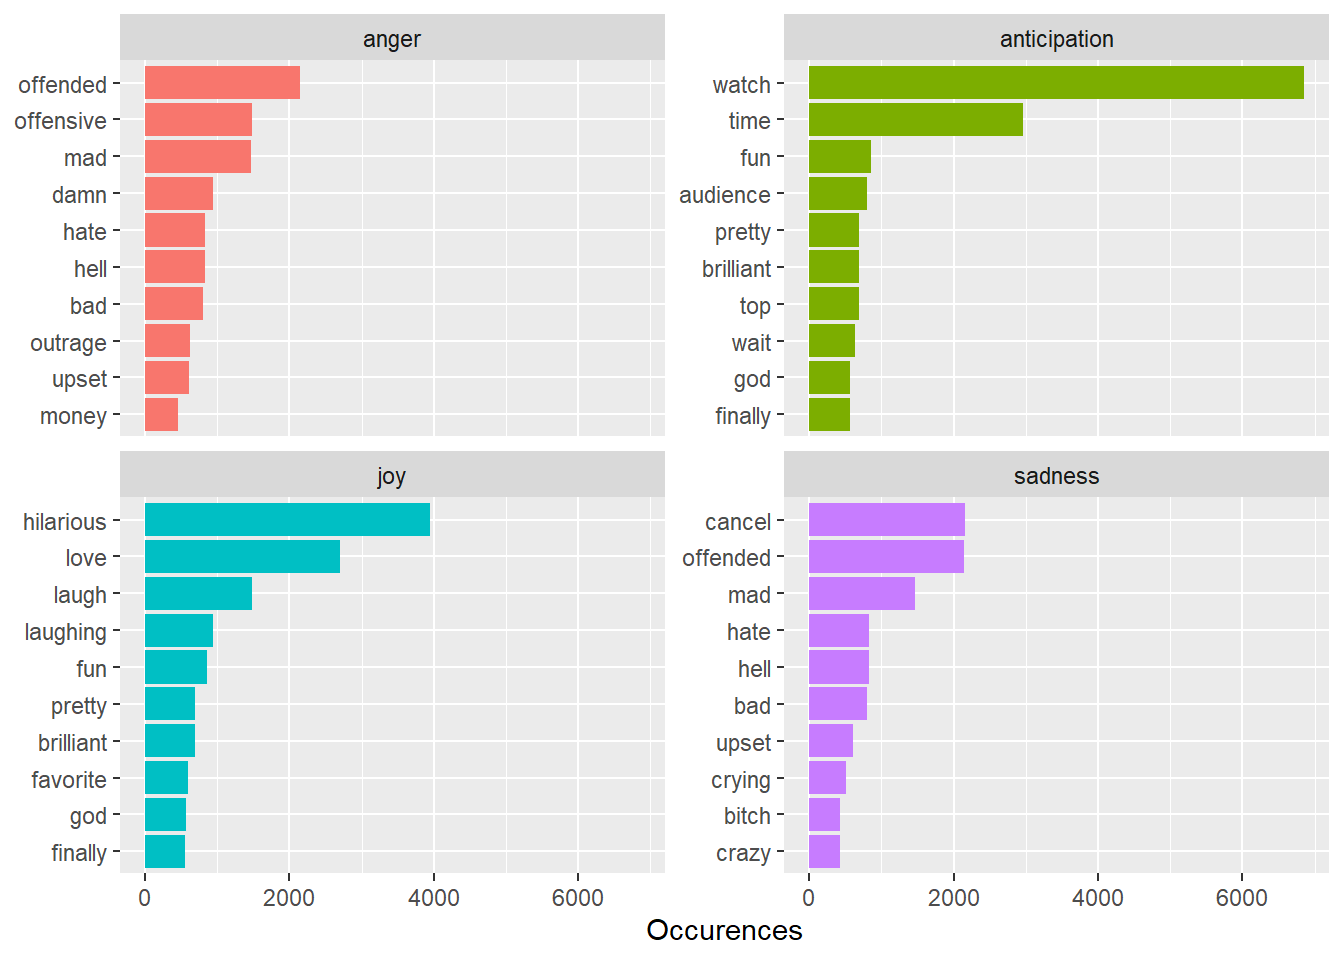
Hilarious was the most used emotion word to describe the special by some distance.
So far we looked at individual words within tweets. But that doesn’t seem completely right. Certainly, we ought to be considering each tweet in its entirety. I used the R package ‘syuzhet’ to get a summary sentiment score for each tweet, with negative and positive values indicating bad and good vibes. I used the “afinn” method to get a sentiment score of each tweet. This looks up each word of a tweet in the “afinn” sentiment lexicon and calculates the score as a sum of the valences of the words divided by the number of words. Read more here - (https://arxiv.org/pdf/1103.2903.pdf). Let’s use it to get a measure of the overall emotional valence in the tweets.
Here’s a distribution of the sentiment scores of each tweeet. Most tweets were netural or did not contain any strong emotions. The average score was 0.54, indicating on average twitterverse viewed the special positively. If you weight the retweets by the number of times they were RTd, the average score turns negative, to -0.76!!!
ggplot(data=DCmenansent3) +
  geom_histogram(mapping=aes(x=sentscore),bins=50) +
  geom_freqpoly(mapping=aes(sentscore))
## `stat_bin()` using `bins = 30`. Pick better value with `binwidth`.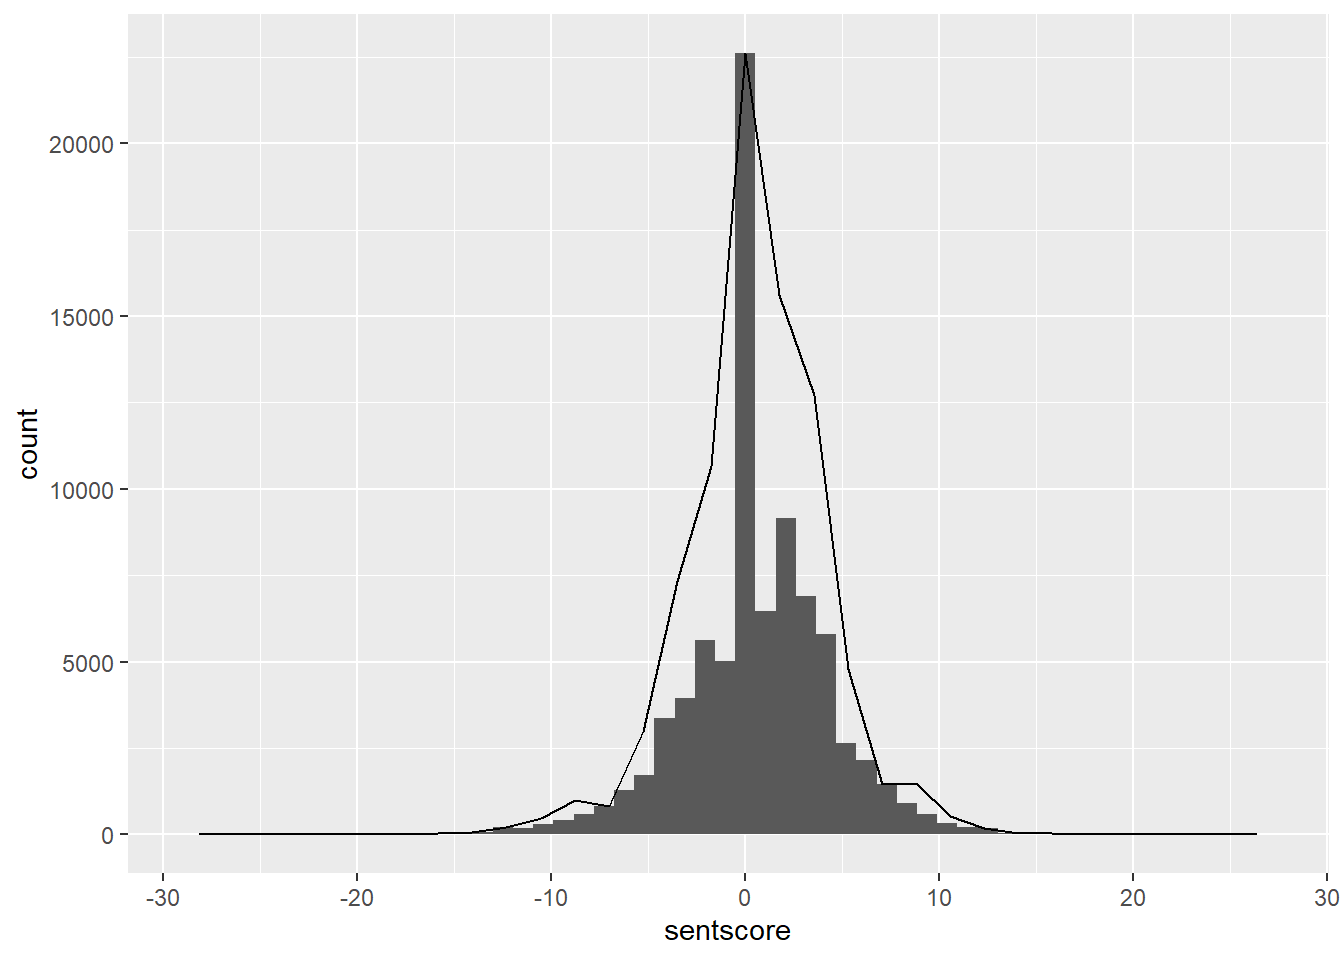
I dug a little deeper and found that of the most RTd tweets with negative sentiment score most just seemed to be quoting the special, like these,
Chappelle said school shooting drills were stupid cause the shooter in the room learning the drills too LMFAOOOOOOOOOOOOO
— Pre K ?????? (@stayfrea_) August 28, 2019
(https://twitter.com/HNICBrian/status/1166394265569832961)
or talking about, not in support of, the negative feedback, like this one,
Why is the Left constantly trying to cancel black men? Kevin Hart? Now, Dave Chappelle?
— CJ Pearson (@thecjpearson) August 27, 2019
There’s a pattern here!
Just excluding these tweets, increased the wieghted mean sentiment score to 0.20 . In all, I think the overall reaction was positive but the sentiment analysis, which relies on mapping each word to an emotion, maybe underestimating it.
In summary, I learnt that a lot of people on twitter enjoyed the special but maybe not as much as they enjoyed talking about it. Also, never upset the Alphabet people, they have all your data!